What P/E Ratio would have made you money on the XJO in the last 10 years?
Over the past decade (2015–2025), investors would have profited from most ASX 200 stocks, provided they didn’t purchase at extreme P/E valuations.
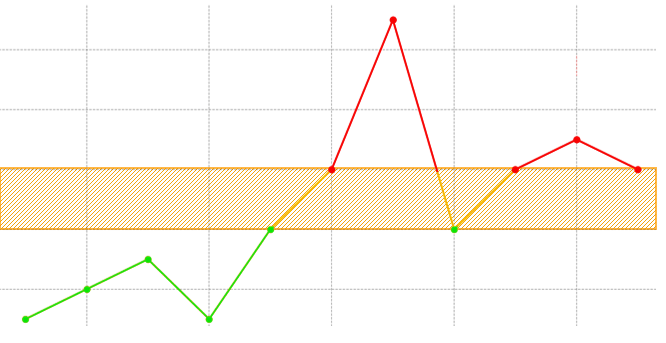
The break-even point sits approximately at P/E ≈ 18–20, depending on the sector.
ASX 200 Total Return: 2015 → 2025
Over the past ten years, the ASX 200 delivered approximately:
- ~7–8% per annum in total returns (price appreciation plus dividends)
- ~8–9% per annum when including franking credits

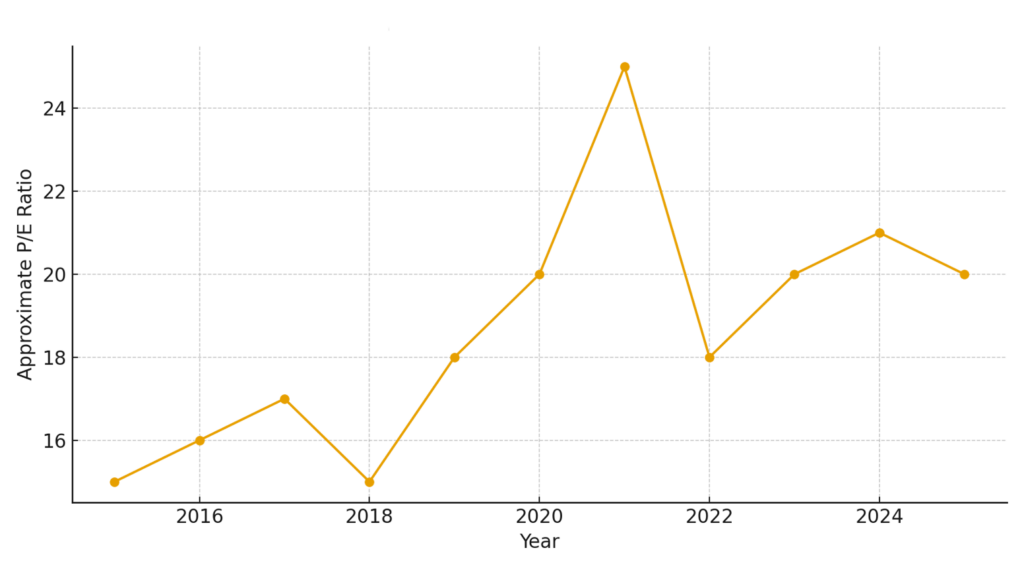
P/E Ranges Across the Decade
Based on approximate historical P/E data:
Remember: the P/E is a lagging indicator based on the previous 12 months’ data.

Simple Summary
⭐ Break-even P/E ≈ 18–20
If you purchased broadly across the ASX at a P/E below 18–20, you almost certainly made money over the 10 years.
Returns by P/E range:
- P/E < 15 → High probability of strong returns
- P/E 15–18 → Good returns
- P/E 18–20 → Break-even to mildly positive returns
- P/E > 20–25 → Significant risk of flat or negative outcomes

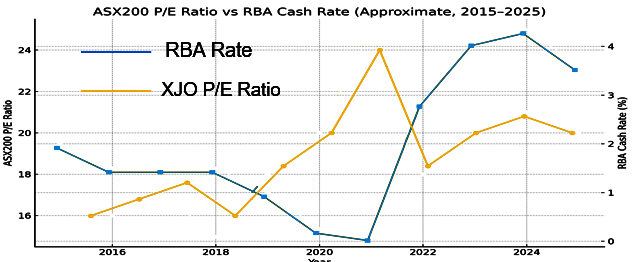
Why Does This Matter?
📉 Overpaying (high P/E) rarely works long-term on the ASX
Australia is fundamentally a high-dividend, low-growth market. Paying more than 20–25× earnings often prices in excessive optimism that fails to materialize.
📈 Value investing (low P/E) works surprisingly well in Australia
Banks, insurers, cyclicals, and industrials may lack glamour, but they compound steadily over time—making them reliable wealth builders for patient investors.

What you learn here has been used in our Trade for Good software.
Click on the button to find our software education videos.
You can read more of our educational articles in the Trade for Good Learn section
Trade for Good Learn