Volume Profile

What Is Volume Profile? the indicator to see where the market has done the most business

Most share charts show volume underneath the price chart. Those vertical bars tell you how many shares traded during a particular day or period.
Volume Profile takes the same trading activity and displays it in a different way. Instead of showing volume by time, it shows volume by price.
That means it answers a different-and often more useful-question: At what prices have buyers and sellers been most active?
This can help investors identify areas where the market has previously found support, encountered resistance or spent time establishing a view of fair value.
Volume by time versus volume by price
Traditional volume appears underneath a price chart.
A tall bar tells you that a large number of shares traded during that day, hour or other selected period.
Volume Profile appears horizontally beside the price chart.
The longer the horizontal bar, the more shares traded around that price.

So the distinction is simple:
| Traditional volume | Volume Profile |
| Shows when shares traded | Shows where shares traded |
| Plotted along the time axis | Plotted along the price axis |
| Highlights busy trading periods | Highlights important price levels |
| Helps confirm momentum | Helps identify market structure |
Both are useful. They simply look at the same trading activity from different angles.
Why Volume Profile matters
A share price chart shows where a stock has travelled.
Volume Profile provides more context about what happened along the way.
If a large amount of trading occurred around a particular price, it suggests that buyers and sellers repeatedly agreed to transact there.
That price area may later become important because:
- investors who previously bought there may defend it;
- investors who missed the opportunity may be waiting to buy;
- investors who bought there may look to exit when price returns;
- institutional traders may have accumulated or reduced positions in that area.
Volume Profile does not tell you whether a stock will rise or fall. It helps you understand where supply and demand have previously been concentrated.

How to read a Volume Profile
A Volume Profile normally appears as a series of horizontal bars positioned beside the chart.
Long bars show prices where a lot of trading occurred.
Short bars show prices where relatively little trading occurred.

Three concepts are especially useful.
-
Point of Control
The Point of Control, often shortened to POC, is the price level with the greatest amount of traded volume during the selected period.
It is usually represented by the longest bar in the profile.
You can think of it as the market’s centre of activity for that period.
Because so much trading occurred there, the Point of Control may become an important reference level if the share price moves away and later returns.
It is sometimes described as an area of fair value, although investors should not assume that the stock is fundamentally cheap or expensive simply because it is trading near the POC.
Point of Control: the price at which the greatest volume was traded during the selected period.

-
High Volume Nodes
A High Volume Node, or HVN, is an area where the profile forms a noticeable bulge.
It shows that a relatively large amount of trading occurred across that price range.
These areas often represent periods of acceptance, where buyers and sellers were comfortable conducting business.
High Volume Nodes may later act as:
- support;
- resistance;
- consolidation areas;
- zones where price movement slows.
A stock may spend time moving around an HVN because the market has previously shown strong interest at those prices.

-
Low Volume Nodes
A Low Volume Node, or LVN, is a thinner part of the profile where relatively little trading occurred.
These areas can indicate that the market did not spend much time agreeing on value.
When a share price enters a Low Volume Node, it may move through that area relatively quickly until it reaches another price zone with greater historical activity.
This is why traders sometimes refer to Low Volume Nodes as air pockets.
That does not mean price will always move rapidly through them, but they can highlight areas where historical support or resistance may be limited.

The Value Area
Some Volume Profile tools also display a Value Area.
This is the price range containing a large proportion of the volume traded during the selected period-commonly around 70%.
The upper boundary is known as the Value Area High, or VAH.
The lower boundary is known as the Value Area Low, or VAL.
Together, they show the main price range in which the market conducted most of its business.
A share price moving outside the Value Area may suggest that the market is testing a new valuation range.
Investors then watch to see whether the move is accepted or rejected.

A simple example
Imagine a share has traded between $18 and $22 during the past three months.
Its Volume Profile shows:
- a large High Volume Node between $19.80 and $20.30;
- a Point of Control at $20.10;
- very little volume between $20.80 and $21.30;
- another smaller High Volume Node around $21.60.
An investor might interpret this as follows:
The area around $20.10 has attracted the greatest trading activity and may be an important support or resistance zone.
If the price moves above $20.80, it may travel relatively quickly through the Low Volume Node towards the next area of stronger trading activity around $21.60.
If the price falls back towards $20.10, investors may watch to see whether buyers return.
This is not a prediction. It is a way of identifying price levels that may deserve closer attention.

What Volume Profile is good for
Identifying support and resistance
Traditional support and resistance lines are often drawn using previous highs and lows.
Volume Profile adds another layer by showing where the greatest amount of trading actually occurred.
A High Volume Node below the current price may act as support.
A High Volume Node above the current price may act as resistance.
These are better treated as zones rather than exact prices.
Understanding breakouts
A breakout may be more meaningful when price moves beyond a High Volume Node and begins trading in an area with little historical volume.
If price enters a Low Volume Node, there may be less previous trading activity to slow the move.
Investors should still look for confirmation through price action, broader market conditions and current volume.
Finding areas of market acceptance
When a stock spends a long time trading around a High Volume Node, it suggests the market is comfortable doing business there.
This may represent a period of consolidation before the next larger move.
The profile helps distinguish between a price level that was briefly touched and one where substantial trading genuinely occurred.
Comparing price with market participation
A share price may rise sharply, but Volume Profile can help show whether substantial trading occurred during the move.
A price area supported by significant volume may carry more weight than a price level reached on relatively limited activity.
Planning entries, exits and risk levels
Some investors use Volume Profile to help identify:
- potential entry zones near support;
- possible profit-taking areas near resistance;
- levels where a trading idea may no longer be valid;
- price zones where movement may accelerate.
Volume Profile should support an investment or trading plan, not replace one.
How to add the Volume Profile to a chart?
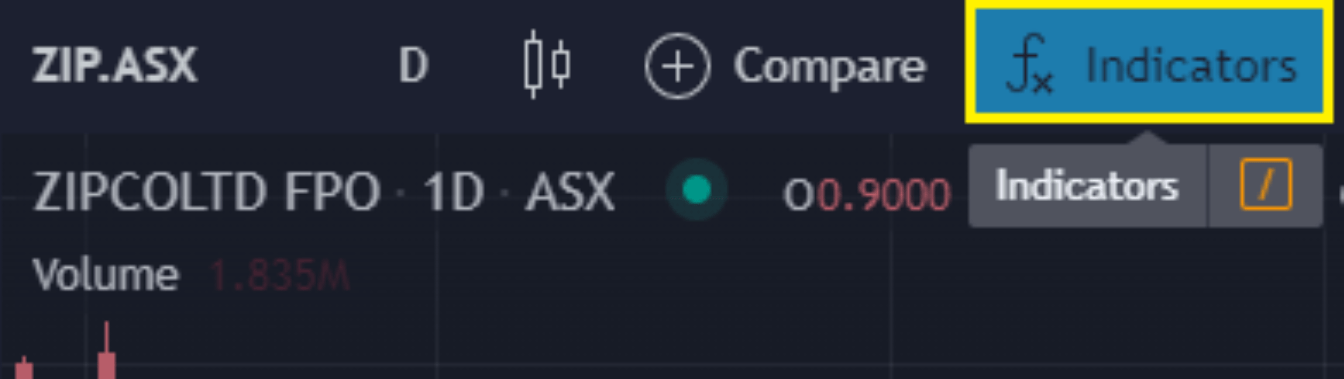
- In the chart, click on Indicators

- Type in Volume Profile to search

- Adjust the values

- It is worth adjust the time series, from daily, to weekly or intraday to get better perspective on the volume over those periods.
- Then to draw on your High or Low Value Node lines, click on the drawing tools on the left menu, click on Lines, then i like using the Horizontal Line.


Common mistakes to avoid
Treating levels as exact prices
Support and resistance are rarely precise to the cent.
Volume Profile should be interpreted as showing price zones, not guaranteed turning points.
Using too little data
A profile based on a very short period may be distorted by one unusually active session.
Consider whether the selected period is relevant to your intended investment timeframe.
Ignoring new information
Historical trading volume cannot account for a new earnings result, takeover proposal, capital raising or regulatory announcement.
Fresh information can rapidly change what the market believes a company is worth.
Assuming high volume means the stock will rise
High volume simply means a large amount of trading occurred.
It does not reveal whether the next move will be higher or lower.
Every transaction has both a buyer and a seller.
Relying on Volume Profile alone
Volume Profile is best used alongside:
- price trend;
- company announcements;
- financial performance;
- broader market conditions;
- risk management.
No chart indicator should be treated as a complete investment process.
Volume Profile versus ordinary volume
The two tools are most useful when used together.
Ordinary volume can show whether activity increased during a particular move.
Volume Profile can show where that activity was concentrated.
For example, ordinary volume may confirm that a breakout occurred with strong participation.
Volume Profile may then help identify the next price area where historical trading activity could create resistance.
One shows when participation increased.
The other shows where participation has been concentrated.

The Bottom Line
Volume Profile gives investors a clearer view of the prices where the market has conducted the most business.
It can help identify:
- fair-value reference areas;
- potential support and resistance;
- zones of market acceptance;
- areas where price may move more quickly.
The simplest way to remember it is:
- Traditional volume shows when shares traded.
- Volume Profile shows where they traded.
- Used carefully, it can add valuable context to a share price chart and help investors make more informed decisions about the levels that matter.
-
How to find where the indicators are and add them to charts?
Read More
What you learn here has been used in our Trade for Good software.
Click on the button to find our software education videos.
You can read more of our educational articles in the Trade for Good Learn section
Trade for Good Learn