What Does the RSI Tell You?
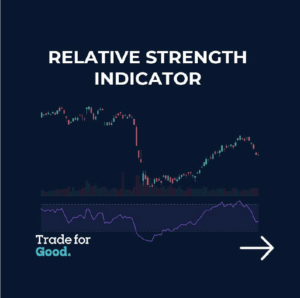
The relative strength index (RSI) is a momentum indicator that measures the speed and magnitude of recent price changes in a security. It assesses whether the security is overvalued or undervalued based on its price.
The RSI goes beyond identifying overbought and oversold conditions. It can also signal potential trend reversals or corrective pullbacks in price, providing insights into when to buy or sell a security.

Key Takeaways?
- An RSI reading of 70 or above indicates an overbought situation, while a reading of 30 or below indicates an oversold condition.
- Traders often interpret the RSI line crossing above the oversold line or below the overbought line as a signal to buy or sell.
- Traders use RSI to forecast the price behavior of a security.
- It’s a technical indicator that can complement other tools in trading strategies.


Overbought or Oversold
Generally, when the RSI indicator crosses above the 30 on the chart, it is a bullish sign, and when it crosses below the 70, it is a bearish sign.
An RSI reading of 30 or below indicates an oversold or undervalued condition.

Overbought refers to a security that trades at a price level above its true (or intrinsic) value. This means that it’s priced higher than it should be, which can signal a sell opportunity for the security.
Limitations of the RSI
Like most technical indicators, RSI signals are most reliable when they align with the long-term trend.
True reversal signals are rare and can be difficult to distinguish from false alarms.

Since the indicator measures momentum, it can remain overbought or oversold for extended periods when an asset exhibits significant momentum in either direction. Therefore, the RSI is most useful in an oscillating market where asset prices alternate between bullish and bearish movements
Should I Buy When RSI Is Low?
Some traders consider it a buy signal if a security’s RSI reading drops below 30. This is based on the idea that the security has been oversold and is therefore poised for a rebound.
However, if the security is caught in a significant downtrend, it might continue trading at an oversold level for quite some time.
 In such situations, traders might delay buying until they see other technical indicators confirm their buy signal.
What Happens When RSI Is High?
The relative strength index (RSI) is primarily used to identify overbought or oversold conditions in a security. A high RSI reading suggests that the security is overbought, indicating a potential price decline.
As a result, this high RSI reading can serve as a signal to sell the security.
-
How to find where the indicators are and add them to charts?
Read More
You can download the offline guide here Relative Strength Index Indicator Guide
What you learn here has been used in our Trade for Good software.
Click on the button to find our software education videos.
You can read more of our educational articles in the Trade for Good Learn section
Trade for Good Learn