What is Earnings per Share (EPS)?
Earnings per share (EPS) is calculated by dividing a company’s profit by the number of outstanding shares of its common stock.

This figure serves as an indicator of a company’s profitability.
Generally, a higher EPS is considered indicative of greater profitability.
Key Takeaways
- EPS indicates how much money a company earns per stock.
- A higher EPS suggests greater value, as investors are willing to pay more for shares of a company that demonstrates higher profits relative to its share price.
- EPS is most valuable when compared to competitor metrics within the same industry or over time.

How is EPS Used?
EPS is a major component in calculating the P/E ratio, where the ‘E’ refers to EPS.
By dividing a company’s share price by its earnings per share, an investor can assess the value of a stock in terms of how much the market is willing to pay for each dollar of earnings.
EPS is one of the many indicators you can use to select stocks if you have an interest in stock trading or investing.

What is a Good EPS?
A good EPS depends on factors such as:
- Recent performance of the company
- Performance of its competitors
- Expectations of analysts who follow the stock
It is important to always evaluate EPS in relation to the company’s share price, such as by considering the company’s P/E ratio or earnings yield.

Limitations of EPS
There are potential drawbacks to EPS:
- A company can manipulate its EPS by buying back stock or reducing shares outstanding, which inflates the EPS number without changing the level of earnings.
- Changes in accounting policies for reporting can affect EPS.
- Additionally, EPS does not consider the price of the share, so it provides little information about whether a company’s stock is over or undervalued.

The Bottom Line
EPS is an important profitability measure used to relate a stock’s price to a company’s actual earnings.
While a higher EPS is generally better, you should consider:
- The number of shares outstanding.
- Potential share dilution.
- Earnings trends over time.

-
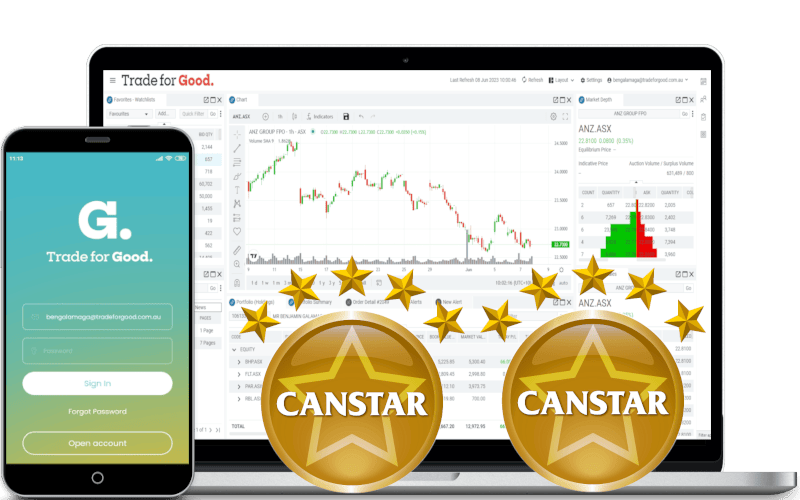
This is where you can find the Fundamental data on the Trade for Good software
Read More
You can download the offline guide here Earning Per Share Ratio Guide

What you learn here has been used in our Trade for Good software.
Click on the button to find our software education videos.
You can read more of our educational articles in the Trade for Good Learn section
Trade for Good Learn


